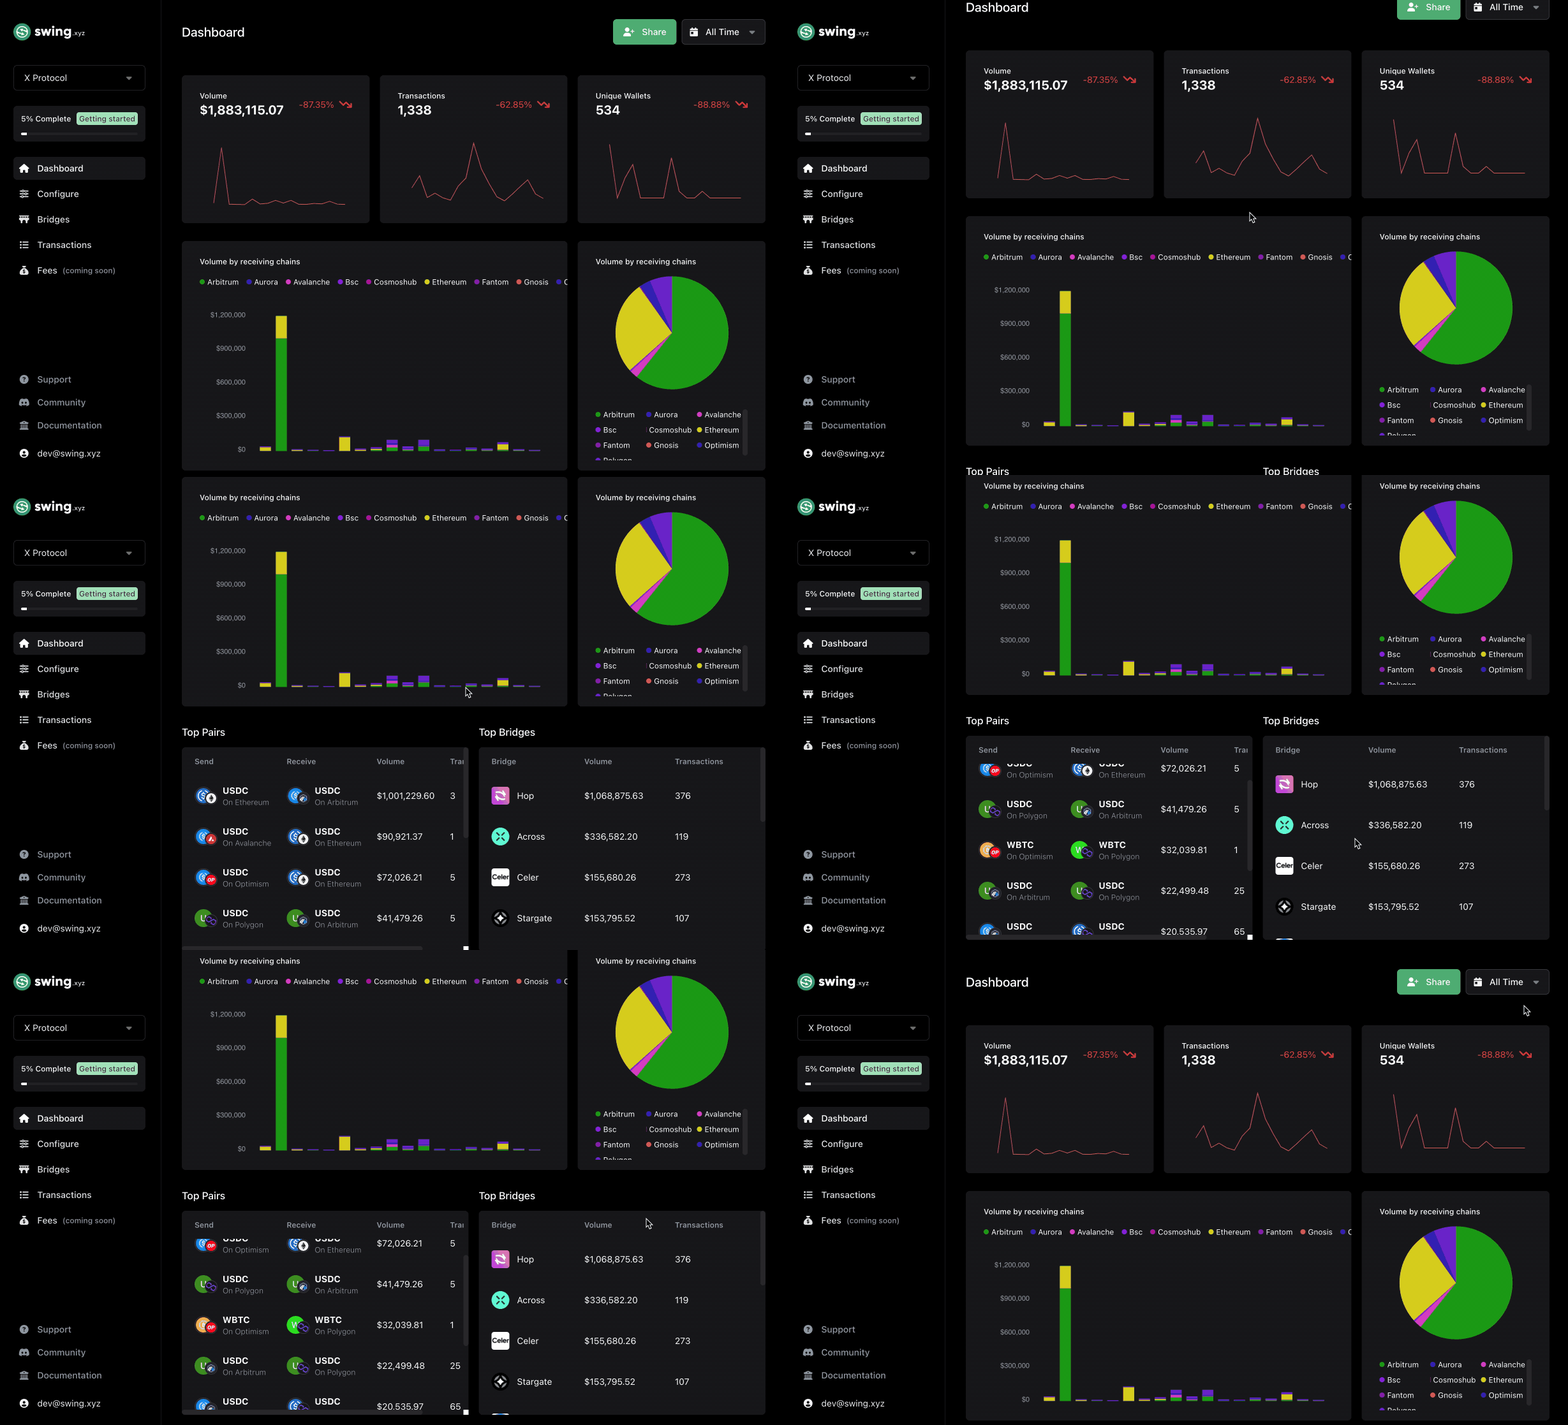
Metrics Dashboard
Access all relevant metrics for your swing project integration in one view.

Metrics
In your project's dashboard, you can access the following data:
- Total transaction volume in USD
- Total number of transactions
- Total number of unique wallets transacted through your integration
- Volume by receiving chains
- Top token pairs by volume and number of transactions
- Top bridges by volume and number of transactions
To see data in your metrics dashboard, you need to integrate the project Identifier.
Filters
By default, the dashboard shows all historical data from when your app sent the first transaction with your project id - "All Time". Select other ranges by clicking on the “All Time” dropdown in the top-hand corner
The following filtering options are available:
- Today
- Yesterday
- Last 7 Days
- Last Month
- Last 3 Months
- Last 6 Months
- Last 12 Months